FabCon Europe 2026 in 18 demos · Part 11 of 18 · Agents
Copilot for Real-Time Intelligence: a dashboard from one sentence
Copilot reads your eventhouse, writes one KQL query per tile, and hands you a draft that still needs a review.
Copilot for Real-Time Intelligence is the AI assistant in the Real-Time Intelligence workload of Microsoft Fabric. It translates natural language into Kusto Query Language (KQL). Its dashboard generator goes one step further. You describe the insights you want, and Copilot builds a whole Real-Time Dashboard on the tables of an eventhouse.
The draft costs one sentence. Reviewing it takes longer, and the review decides whether the numbers are right. This post follows the demo from FabCon Europe 2026 in 18 demos, then lists what to check before you share the result.
In short
- Copilot for Real-Time Intelligence turns one sentence into a Real-Time Dashboard on an eventhouse. In the demo it built twelve tiles, each backed by its own KQL query.
- It is in preview. The Copilot pane shows the label, the Learn how-to page shows none. It needs a paid F2 or P1 capacity and up, and the Copilot tenant switch on.
- Review every tile before you share the dashboard. Check the time window each query uses, how each KPI is defined, and whether the last time bin is complete.
What Copilot for Real-Time Intelligence is and how it works
Copilot in Real-Time Intelligence turns plain language into KQL. It already helps in KQL querysets, in the tile editor, and in data exploration on a dashboard. Dashboard generation is the largest step. Copilot writes the whole dashboard, not one query.
You start on the home page of an eventhouse. Under New Real-Time Dashboard, select Generate with Copilot. A KQL queryset offers the same path through Generate with Real-Time Dashboard. Learn asks you to describe three things: your goal, the data to prioritize, and how to organize the dashboard.
It helps two groups. Operators who know the questions but not KQL get a working first draft. Engineers get a scaffold with the query for every tile in reach. After the draft, a related preview lets viewers question the dashboard data in plain language and save the answers as new tiles.
Copilot then works from the tables in the selected KQL database. It shows its thought process in the pane, and you can refine the request with follow-ups. When you select Start dashboard creation, you name the dashboard, pick a workspace, and select Create. The result is an ordinary Real-Time Dashboard. Every tile runs its own KQL query, and you can change the query or the visual before you save.
Three gates stand in front of the pane. An admin must turn on the Copilot tenant switch. The workspace needs a paid capacity, F2 or P1 and up, because trial SKUs are not supported. The capacity must sit in a supported region. Outside the US and the EU, Copilot is off by default until an admin allows processing outside the capacity's geographic region.
No extra license is involved. Copilot consumes capacity units from your Fabric capacity. Learn sets the rate at 100 CU seconds per 1,000 input tokens and 400 CU seconds per 1,000 output tokens, and Fabric runs Copilot requests as background jobs.
What the demo shows
The clip runs on the KQL database eh_oud_trials. Its one table, blotter_events, holds 3,000 synthetic blotter tests from the eight hours before the load. Each row records a tester, a booth, a formula, and whether the tester picked the test formula or the reference.
The pane carries a Preview label from the first frame. Its three example prompts already name blotter_events, which is what Learn means by data-specific prompts. Every Copilot answer carries the note “AI-generated content may be incorrect.” Figure 2 follows the clip stop by stop.
- YouThe Copilot pane opens on eh_oud_trials with three example prompts.
- YouThe prompt goes in: one sentence, three requests.
- CopilotThinking, then Building answer.
- CopilotSearch schema.
- CopilotFormula summary table.
- CopilotDone. “I have the full context now.”
- YouAccept the name Preference Test Overview and select Create.
- ResultTwelve tiles render, each with its own KQL query.
The finished dashboard has twelve tiles. Four stat tiles show 3K testers, a 57.3 percent first-choice share, 4 active booths, and 376 testers per hour on average. Charts follow for share over time per formula, testers per hour, share by booth, events by booth, and share and testers by formula. Two tables close the page: Recent Preference Events and Formula Summary. At 0:46 a tooltip shows formula OB-106 at 62.6 percent.
Two numbers can be checked against the data. 3,000 events over eight hours is 375 per hour, so the 376 average holds. The loader script seeds an expected share per formula, and those six values average 57.3 percent, the number on the donut. The eventhouse holds different data from the lakehouse trials, so its shares do not match the 68 percent in the Fabric data agent demo.
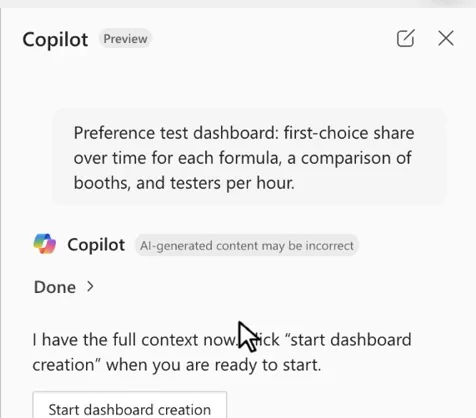
0:18: Preview label, the AI-content note, and the Start dashboard creation button.Limits and catches: what to review before you share
The dashboard looks finished. Treat it as a draft that Copilot wrote, and review it the way you review a pull request.
Catch: the time window. The filter bar reads Time range: Last 1 hour, while most tile titles say Last 8h. Learn says the time range filter appears only when a tile query uses _startTime and _endTime. Open every tile and check which window its KQL uses. A tile with a fixed window ignores the picker, and Activator disables Set alert on tiles with a custom time range.
- 1. Time window: check whether each tile follows the dashboard time range or a fixed window, and make the title match.
- 2. Partial bins: the Testers per Hour line falls at the right edge. Check whether the last hour is still filling before anyone reads it as a drop in traffic.
- 3. KPI definitions: check that “first-choice share” in the KQL means what your team means, and compare it with a query you trust.
- 4. Alerts: Activator rules need a tile query that filters on
_startTimeand_endTime. Rewrite fixed-window tiles before you promise alerts.
Six more limits come from Learn and the runbook:
- Preview: the product labels the feature preview. Keep it off the critical path of a project.
- Output varies: the runbook warns that the tile layout changes between runs. Save and version the dashboard you approve, not the prompt.
- Tile count: in the demo, three requests produced twelve tiles. Delete the tiles nobody will act on.
- Capacity use: generation spends Copilot tokens from your capacity. The tile queries then run on the eventhouse like any other dashboard.
- Scope: Copilot builds from the tables of the one database you select. Data from another database needs a second data source on the dashboard.
- Sharing: Learn separates dashboard permissions from data access. The default, pass-through identity, shows each viewer only the data they can already query. The dashboard editor's identity shows every viewer the data the editor can reach. Choose it only when every viewer may see what the editor sees.
Run it yourself
The runbook D09 rebuilds the demo in a tenant you control. You need a paid capacity with Copilot turned on, plus the eventhouse eh_oud_trials that the setup script creates.
cd demos
pip install -r requirements.txt
cp config.example.env config.env    # subscription, resource group, capacity name
python3 fabdemo.py up
python3 fabdemo.py eventhouse       # reload right before the demo
The 3,000 events cover the eight hours before you load them, so reload them right before you record.
- Open the KQL database eh_oud_trials.
- Select Real-Time Dashboard, then Generate with Copilot.
- Send the prompt below and follow the reasoning in the pane.
- Select Start dashboard creation, then Create.
Preference test dashboard: first-choice share over time for each formula, a comparison of booths, and testers per hour.Expected result: a new dashboard with tiles for first-choice share per formula over time, booth comparison, and testers per hour. Tile layout varies between runs.
Time and cost: about 5 minutes, on the F8 capacity from up. The recap README puts F8 at about 1.41 EUR per hour in France Central, at the Azure retail price on October 21, 2026. Pause it with python3 fabdemo.py capacity pause when you finish.
To review a tile, add a check tile of your own. The query below is not Copilot's. It computes the share of test picks per formula and follows the dashboard time range:
// Check tile: share of testers who picked the test formula, per formula
blotter_events
| where event_time between (_startTime .. _endTime)
| summarize TestSharePct = round(100.0 * countif(first_choice == "test") / count(), 1) by formula_id
| order by formula_id asc
If its numbers differ from Copilot's tiles, open Copilot's KQL and find out why before anyone else sees the dashboard.
Fix what you find with Copilot in the tile editor. Switch the dashboard to Editing mode, open the tile, and describe the change in plain language, for example “use the dashboard time range instead of the last 8 hours.” Copilot keeps the conversation, so you can refine with follow-ups. Select Apply, read the KQL it wrote, then select Done and save.
What to do on Monday
On Monday: Pilot Copilot for Real-Time Intelligence on one eventhouse.
Pick an eventhouse whose numbers you already know, so a wrong tile stands out. If the pilot works, the operations agent in Monitor hub is the next Real-Time Intelligence agent to try. It needs workspace monitoring, which also lands in an eventhouse.
Key facts at a glance
Checked on Microsoft Learn on November 3, 2026.
| ID | Fact | Source |
|---|---|---|
| K1 | Status: Preview label in the Copilot pane. The Learn how-to page, dated October 4, 2026, carries no label. | Learn: Generate Real-Time Dashboards with Copilot |
| K2 | Copilot-assisted data exploration in Real-Time Dashboards is labeled preview on Learn. | Learn: Copilot-assisted real-time data exploration |
| K3 | Entry points: New Real-Time Dashboard, then Generate with Copilot, on an eventhouse. Generate with Real-Time Dashboard in a KQL queryset. | Learn: Generate Real-Time Dashboards with Copilot |
| K4 | Capacity: paid F2 or P1 and up. Trial SKUs are not supported. | Learn: Generate Real-Time Dashboards with Copilot |
| K5 | Admin setup: Copilot tenant switch on. Outside the US and the EU, also allow processing outside the capacity's geographic region. | Learn: Copilot tenant settings |
| K6 | Billing: no extra license. 100 CU seconds per 1,000 input tokens, 400 CU seconds per 1,000 output tokens, run as a background job. | Learn: Copilot consumption |
| K7 | Time range keywords: _startTime and _endTime. The filter appears only when a tile query uses them. | Learn: Use parameters in Real-Time Dashboard queries |
| K8 | Alerts: Activator can set an alert on a tile only when its query filters on _startTime and _endTime. | Learn: Ingestion from Real-Time Dashboards |
| K9 | Announced: Microsoft's keynote-day blog, September 29, 2026. | Microsoft Azure blog: FabCon and SQLCon 2026 |
| K10 | Demo result: 12 tiles, 3K testers, 57.3 percent first-choice share, 4 booths, 376 testers per hour. | Runbook D09 |
Frequently asked questions
Is Copilot for Real-Time Intelligence generally available?
No. The Copilot pane in Fabric shows a Preview label as of November 3, 2026. The Learn how-to page for dashboard generation carries no label, and Learn labels the related Copilot data exploration in Real-Time Dashboards as preview.
How do I generate a Real-Time Dashboard with Copilot?
Open the eventhouse that holds your data, then under New Real-Time Dashboard select Generate with Copilot. Describe your goal, the data to prioritize, and the layout. Select Start dashboard creation, name the dashboard, and select Create. Review the tile queries before you save.
Does Copilot in Real-Time Intelligence need an extra license?
No. Copilot in Fabric consumes capacity units from your Fabric capacity instead of a per-user license. It needs a paid F2 or P1 capacity or larger, and an admin must turn on the Copilot tenant setting. Trial capacities are not supported.
Can I edit the KQL that Copilot writes for a dashboard?
Yes. Every tile in the generated dashboard runs its own KQL query. Open a tile in editing mode to change the query or the visual, or ask Copilot to refine it in natural language. Save the dashboard when the tiles show what you expect.
Why can't I set an Activator alert on a tile Copilot generated?
Learn allows alerts only on tiles whose KQL filters on the dashboard time range with _startTime and _endTime. On a tile with a custom time window, Set alert is disabled. Rewrite the tile query to use the two parameters, then set the alert.
Why can't I use Generate with Copilot in my eventhouse?
Check three gates. The Copilot tenant switch must be on, the workspace must sit on a paid F2 or P1 capacity or larger, and the capacity must be in a supported region. Outside the US and the EU, an admin must also allow processing outside the capacity's geographic region.
Sources
Microsoft Learn and the Microsoft Fabric blog, checked on November 3, 2026.
- Generate Real-Time Dashboards with Copilot
- Copilot for Real-Time Intelligence
- Copilot-assisted real-time data exploration (preview)
- Create a Real-Time Dashboard
- Use parameters in Real-Time Dashboard queries
- Ingestion from Real-Time Dashboards (Activator)
- Real-Time Dashboard permissions
- Copilot tenant settings
- Consumption rates and billing for Copilot in Fabric
- How Copilot in Microsoft Fabric works
- FabCon and SQLCon 2026 in Barcelona, Microsoft Azure blog, September 29, 2026
- Runbook D09: Copilot generates a Real-Time Dashboard
- Demo setup script, fabdemo.py