FabCon Europe 2026 in 18 demos · Part 9 of 18 · Agents
Operations agent: root cause for a failed pipeline in Monitor hub
Select Investigate on a failed Fabric pipeline run, and a read-only agent explains what broke, as you, from workspace monitoring data.
Fabric observability investigation is a read-only analysis that the operations agent runs on a failed data pipeline run. You start it with Investigate in Monitor hub. The agent reads the workspace monitoring data and the pipeline definition, then reports what happened, a timeline, the likely root cause, and next steps.
In FabCon Europe 2026 in 18 demos, this is the agent for operators. It cannot break anything, because it writes nothing. Its weak point is a prerequisite: without workspace monitoring, there is nothing to investigate.
In short
- Select Investigate on a failed pipeline run in Monitor hub. The operations agent reads the monitoring data and the pipeline definition, then returns the likely root cause and next steps.
- The investigation is read-only and runs as you, with a short-lived Entra ID token per call. It does not rerun jobs or change the pipeline.
- It needs Contributor or higher and workspace monitoring turned on before the failure. Both features are preview, and billing for investigations is not enabled yet.
How the operations agent investigates a failed pipeline
An investigation is a capability of the Fabric operations agent. When you enable workspace monitoring, Fabric creates a monitoring item with an eventhouse for logs and an operations agent under it. Investigate on a failed run opens a chat with that agent, already scoped to the workspace and the job run. You type nothing.
The agent reads job logs, copy activity logs, and error details from monitoring, plus the pipeline definition through Fabric APIs. It correlates them, checks run history for a pattern, and writes the report. Follow-up questions in the same chat send it back to read.
The investigation runs as the signed-in user, and Entra ID issues a short-lived token for each call. It sees only what you can already see. Read-only covers the investigation. An operations agent item you configure yourself can send Teams messages or trigger actions, which is a separate setup.
What the operations agent demo shows
The pipeline pl_daily_trials_load fails on purpose, because its landing file never arrives. The recording cuts the wait.
- 0:00
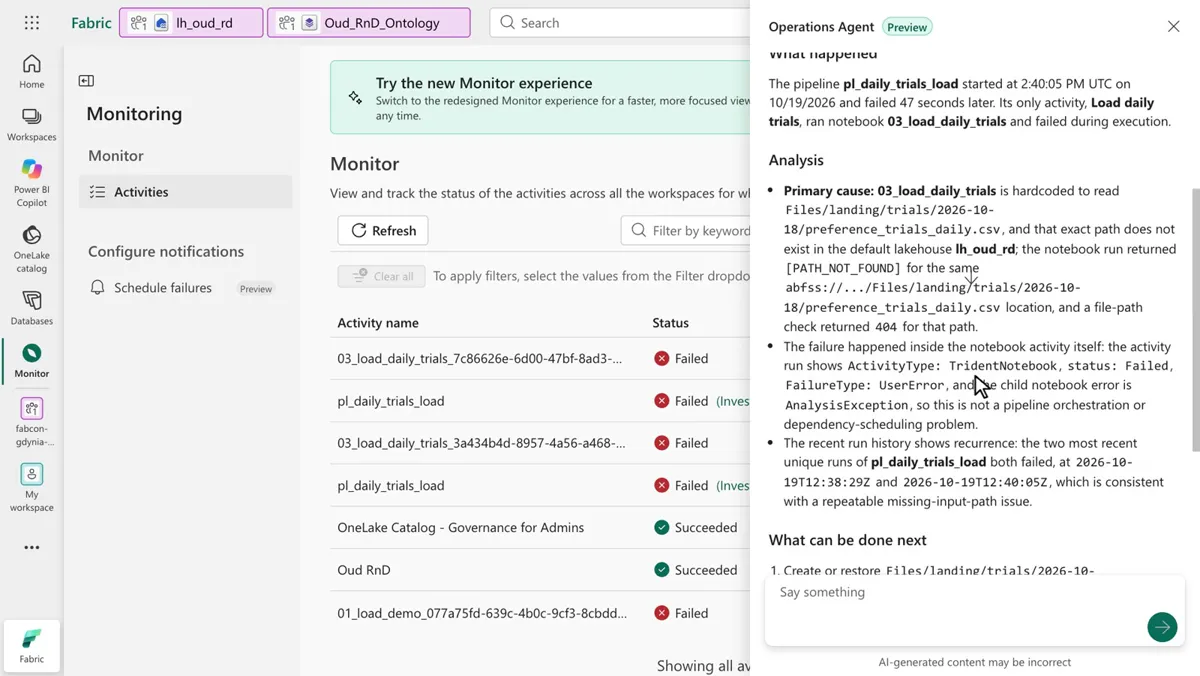
- Monitor hub lists pl_daily_trials_load as Failed, with an Investigate link. The Operations Agent pane opens with a prefilled request that names the pipeline, the run start time, and the run ID.
- 0:02
- Status lines while the agent gathers and correlates signals.
- 0:16
- The report names the cause: notebook 03_load_daily_trials is hardcoded to read Files/landing/trials/2026-10-18/preference_trials_daily.csv, which does not exist in lh_oud_rd. The notebook returned PATH_NOT_FOUND.
- 0:18
- The failure sits in the notebook activity, a UserError with an AnalysisException, so it is not an orchestration problem. The two most recent runs both failed, so it recurs.
- 0:20
- Next steps: restore the file, parameterize the landing path instead of hardcoding the date, confirm the upstream delivery, then rerun.
- 0:32
- Scrolled up: the run failed 47 seconds after it started, and its only activity ran the notebook. The agent changed nothing.
The root cause is a date hardcoded into a file path. Of the four fixes, the parameterized landing path is the one that stops a repeat.
Operations agent limits and catches
The catch: monitoring must be on before the failure. Workspace monitoring does not backfill, so a run that failed earlier has no data to investigate.
- Before monitoringRun failsNot captured. Nothing to investigate.
- Day 0Monitoring onFabric creates the eventhouse and an operations agent.
- LaterRun failsLogs land after a short delay.
- Minutes laterInvestigateReport from captured data, as you.
- 30 days after the runData removedDefault retention ends.
Investigable window
- Only data pipeline run failures are supported.
- The Investigate link shows even for users who cannot run it. You need Contributor or higher.
- Sessions are temporary. A refresh clears the chat, and its content is not retained.
- Workspace monitoring is preview and uses capacity. One monitoring item collects for a workspace at a time.
- Check timestamps. The demo report labels the start 2:40:05 PM UTC, while its own run history lists 12:40:05Z.
The monitoring database is an eventhouse, so it can feed a Real-Time Dashboard, like the one Copilot for Real-Time Intelligence drafts from one sentence. For the tenant-wide view of labels and settings, see OneLake catalog Govern.
Run the operations agent demo yourself
You need the pipeline pl_daily_trials_load from the recap repo setup script and Contributor or higher. Turn on monitoring in Workspace settings, wait for the monitoring eventhouse, then run the pipeline again so the failure lands in monitoring.
python3 fabdemo.py up
python3 fabdemo.py pipeline
Open Monitor hub, find pl_daily_trials_load under Job runs, and select Investigate. There is no prompt to write. The pane opens with a request like this:
Investigate the failure in pipeline pl_daily_trials_load for the run that started on <date and time> (pipeline run ID <run ID>)Expected result, per runbook D07: the agent names the notebook activity and the missing file, and proposes checking the upstream delivery before a rerun. Time and cost, as the runbook states: about 5 minutes, on the F8 capacity from up. The clip shows the classic Monitor hub list, while Learn and the runbook use Job runs in the new Monitor hub.
What to do on Monday
On Monday: Turn on workspace monitoring on one workspace. The operations agent has nothing to work with without it.
Key facts at a glance
Checked on Microsoft Learn on November 3, 2026.
| ID | Fact | Source |
|---|---|---|
| K1 | Observability investigation and workspace monitoring are both preview. | Learn: Investigation overview, Workspace monitoring |
| K2 | Supports data pipeline run failures only. | Learn: Investigation overview |
| K3 | Read-only. Does not change the pipeline or rerun jobs. | Learn: Investigation overview |
| K4 | Runs as the signed-in user, with a short-lived Entra ID token per call. | Learn: Investigation overview |
| K5 | Contributor or higher on the workspace. | Learn: Run an investigation |
| K6 | Monitoring captures data only after it is enabled. No backfill. | Learn: Workspace monitoring |
| K7 | Monitoring data is retained for 30 days by default. | Learn: Workspace monitoring |
| K8 | Billing is not currently enabled for observability investigation. | Learn: Investigation overview |
Frequently asked questions
What is the operations agent investigation in Microsoft Fabric?
Fabric observability investigation is a preview capability of the operations agent. Select Investigate on a failed data pipeline run in Monitor hub, and the agent reads monitoring data and the pipeline definition, then reports the likely root cause and next steps.
Does the Fabric operations agent change or rerun my pipeline?
No. An investigation is read-only. It does not change the pipeline or rerun jobs, and it runs with the identity of the signed-in user. Restoring a file or rerunning the pipeline stays with you.
Why does Investigate fail when I can see the link?
The Investigate link can appear for users with only the Reader role, or when the workspace has no operations agent. An investigation needs Contributor or higher on the workspace and workspace monitoring enabled.
Why can't the investigation find my failed pipeline run?
Workspace monitoring captures data only after it is turned on and does not backfill, so a run that failed earlier has no data. Monitoring data can also arrive with a short delay. Wait a few minutes and start the investigation again.
Does an operations agent investigation cost capacity units?
Microsoft Learn states that billing is not currently enabled for observability investigation. Workspace monitoring itself uses Fabric capacity, so the prerequisite still has a cost.
Sources
Microsoft Learn and the Microsoft Azure blog, checked on November 3, 2026.